
Can reflective roofs and solar panels keep buildings cooler?
Reflective roofs bounce sunlight away; solar panels shade the roof beneath them. Here is how each works, what field studies have measured, and what to ask about your own roof.
Established technology
Established technologies; cooling benefits vary by building and climate.
Sometimes, and by very different amounts. Both approaches can make a roof less hot in strong sun, and some studies find less heat reaching the rooms below. But a cooler roof surface is not automatically a cooler room, a lower energy bill or a cooler street. The result depends on the climate, how well the roof is insulated, its condition, how the building is used and, for panels, how they are fitted.
On a sunny day a roof can be one of the hottest surfaces on a building. At three shopping centres in New South Wales, Australia, roof surfaces averaged between about 14 °C and 28 °C above the air measured 8 m higher around midday, mostly in summer monitoring (CRC for Low Carbon Living, 2018). It is reasonable to ask whether a reflective coating, rooftop solar panels or both could help.
Reflecting versus shading
The two approaches work in different ways.
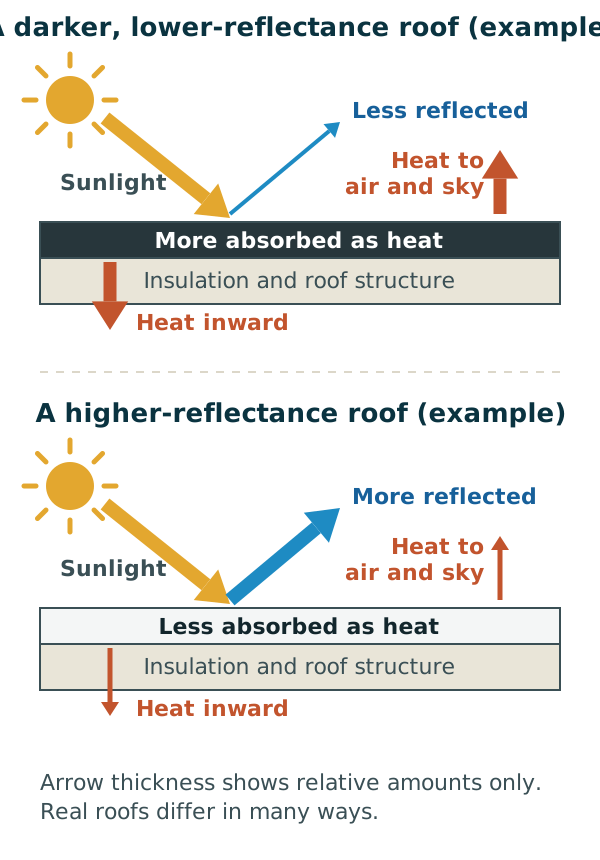
A reflective roof (often called a cool roof) has a light or specially formulated surface. It sends more sunlight straight back to the sky, so less is absorbed as heat. The share of sunlight reflected is called solar reflectance: 0 means none, 1 means all.
Solar panels do not mainly reflect sunlight. They intercept it. The panel absorbs the energy, and the roof beneath sits in shade. How warm that shaded roof gets then depends on the gap, the airflow and what the panel itself does with the heat.
Panels also generate electricity, which is a real and separate benefit. This article looks only at what they do to the roof beneath them.
Five things that get measured
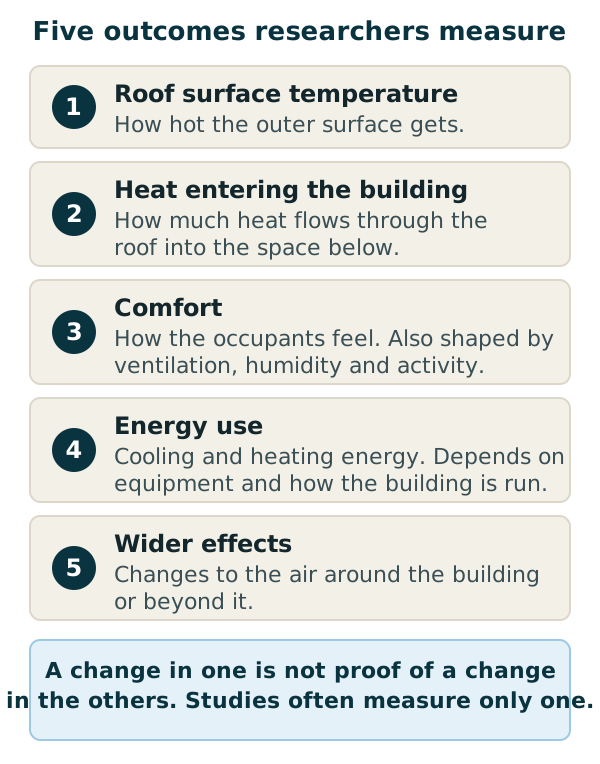
When studies say a roof is "cooler", they may mean different things. Keeping them apart avoids most confusion.
- Roof surface temperature. How hot the outer surface gets. It is the easiest to measure and the most dramatic.
- Heat entering the building. How much heat actually passes through the roof into the space below. This depends on insulation as well as the surface.
- Comfort. How people in the building feel, which also depends on ventilation, humidity and activity.
- Energy use. Cooling and, in cooler seasons, heating energy. It depends on the equipment and how the building is run.
- Wider effects. Changes to the air around and above the building. We touch on these only briefly.
A change in one of these is not proof of a change in the others, and many studies measure only one or two.
Reflective roofs: what has been measured
A 1990s field demonstration at three commercial buildings in Northern California raised the roofs' solar reflectance to about 0.6, from a starting range of roughly 0.16 to 0.25. At one building, the roof surface on hot, sunny summer afternoons fell from about 79 °C to about 49 °C (Konopacki et al., 1998). That is surface temperature only, compared across different years.
Air-conditioning electricity fell by 18%, 13% and 2% at the three buildings, after adjusting for outdoor temperature. The spread is the useful part. The authors link the larger savings to roofs that let more heat through and the smallest to a building where internal loads dominated. In other words, the benefit followed how much heat the roof was passing inside in the first place. Three buildings are not a forecast for yours.
In Austin, Texas, five treated homes had usable before-and-after data. Their daytime cooling electricity fell by between about 5% and 49%, and the lowest result was not statistically significant. Night-time results were mixed, and one home used more (Blackhurst, 2020). With so few homes, those estimates should be read cautiously.
The Australian measurements also found warm air just above the roofs: at its warmest, air 0.5–1.5 m up reached 7 °C above the air measured 8 m higher, while the average daytime difference at such locations was 1.0–2.2 °C. In the cases the report simulated, ignoring this warm air tended to underestimate the cooling-energy benefit of a reflective roof by about half. Its authors say the simulation results should not be extrapolated beyond those case-study buildings.
Solar panels as shade
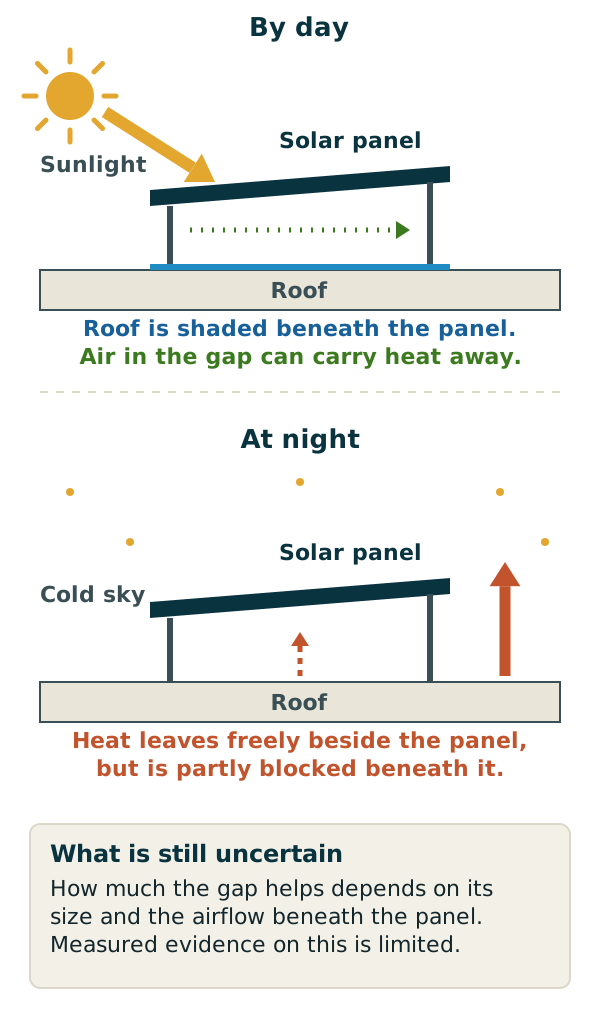
In one picture: by day, the panel shades the roof and air in the gap can carry heat away. At night, the panel sits between the roof and the cold sky.
Three field studies show how this plays out.
San Diego, California. Researchers imaged the ceiling of an unoccupied concrete laboratory building from below over a weekend in April 2009 and analysed one day, 19 April, in detail. Under a slightly tilted array raised about 10 cm above the roof, the ceiling was up to about 2.5 °C cooler than under the exposed roof in the late afternoon. At night, the ceiling under a second array mounted flush to the roof was the warmest of the areas compared (Dominguez et al., 2011).
Albuquerque, New Mexico. Two small test huts with dark shingles were compared over about five weeks in August and September 2014. On one, lightweight panels were stuck to the roof with an air gap of under 5 mm, covering 69% of it. The daily peak shingle temperature under the panels averaged about 13 °C lower than on the other hut (the paper's figure caption says 12.5 °C), and the authors expect less difference in cooler months. The daily peak heat flux through the ceiling was about 49% lower than in the other hut, a percentage worked out for each day and then averaged (Shukla et al., 2018). That describes heat entering through the ceiling at its daily peak, not a building's energy use.
Sydney, Australia. Researchers logged roof temperatures under a north-facing array about 10 cm above the roof, and on uncovered roof beside it. On sample days the maximum daytime difference was about 5 °C in winter and 20 °C in summer, with the covered roof cooler. At night the covered roof was warmer, by about 1 °C in winter and 3 °C in summer (Odeh and Pearling, 2025).
Two things stand out. Panels shade in winter as well as summer, so in a cold climate they may also reduce useful winter heat. And the night-time results in San Diego and Sydney suggest panels can slow a roof's cooling after dark. Whether either matters depends on the climate and the building.
How much the gap matters is less clear. In the Australian measurements, air about 0.15 m above the roof between the panels tended to be hotter than air at the same height over nearby uncovered roof, while air at 1.5 m above the panels was not noticeably influenced; the report gives no figure for the difference (CRC for Low Carbon Living, 2018). In San Diego, the ceiling under the array raised about 10 cm was cooler than under the flush one, but the arrays differed in more than height. The evidence on mounting is thin.
What about both together?
People often ask about panels over a reflective roof. We did not find measured evidence we could verify on what a reflective layer adds beneath panels, so what follows is reasoning, not a finding.
Under panels, much of the sunlight is already intercepted, so a reflective surface beneath has less to reflect. Any added effect would probably depend on how much of the roof the panels cover, how much air moves beneath them and how the roof surface behaves in winter. If you are weighing the combination for cooling, it is reasonable to ask whoever recommends it for measurements from a comparable roof and climate, and what share of the benefit is expected from each layer.
Winter, ageing and installation
Winter. A surface that reflects sunlight in summer also reflects it in winter. Whether that costs heating energy depends on climate and insulation, and the evidence covers it least well. The Austin study assumed a 2–5% rise in heating energy; it did not measure one. A simulation of simplified shopping-centre and airport buildings across seven Australian climate zones found about 4.0% less electricity and about 8.4% more gas on average, varying strongly by climate. That is a model of particular buildings, and the authors say its above-roof air model needs verifying for winter conditions (CRC for Low Carbon Living, 2018).
Ageing. Reflective surfaces tend to lose reflectance as dirt builds up. In one set of California samples, reflectance fell from 0.57 to about 0.54 over 19 months. The samples were collected in spring, after the winter rains, so they probably understate the loss after a dry summer (Berdahl et al., 2008). Soot absorbs sunlight strongly, and a laboratory method has reproduced about three years of outdoor ageing for many products, though it does not simulate microbial growth (Sleiman et al., 2013).
Roof life and cost. Reflective coatings are sometimes said to extend a roof's life. We did not find demonstrated service-life evidence for that. The Austin analysis assumed a long coating life and found whitening mainly paid off for older roofs (Blackhurst, 2020). The Californian authors note that energy savings alone give weak economics unless the roof lasts.
Installation. Details such as fixings, roof penetrations, warranties and glare are best raised with the installer before work starts.
Beyond the roof
Neighbourhood effects. Reflective roofs are often discussed as a way to ease urban heat. That depends on how many buildings change, and the evidence we reviewed does not let us say how much a single roof changes the street.
Green roofs. Planted roofs are another way to reduce heat gain, with different benefits and trade-offs. They deserve their own article.
Questions worth asking
- What are you trying to reduce? Surface temperature, indoor heat, cooling energy or peak demand may each give a different answer.
- What is the roof like? Its condition, its insulation, and whether a replacement is due anyway.
- What does winter look like? How much of the year is cold, and has anyone estimated the heating side for your climate?
- Where did the evidence come from? Were the results measured or modelled, and from a climate, roof and building like yours?
- For panels, what is beneath them? The gap, the airflow and how much of the roof they cover.
- Who keeps it working? How the roof will be cleaned and inspected, and whether the warranty allows for it.
Studies at a glance
This is a review of selected studies, not a complete survey.
| Study | Place and type | What it measured or modelled | Where the figures are | Notes that affect interpretation |
|---|---|---|---|---|
| Konopacki et al., 1998 | Northern California; field demonstration at three commercial buildings | Roof surface temperature; air-conditioning electricity before and after coating | Executive Summary p. 10; Table 2.1 p. 21 (reflectance, surface temperature); Table EX.1 p. 12 (electricity); Section 3.3 p. 48 (explanation of the spread) | Different years before and after; short comparison windows; funded by the US EPA through the Department of Energy |
| Blackhurst, 2020 | Austin, Texas; seven treated homes, 107 comparison homes | Hourly household cooling electricity; life-cycle cost model | Table 4 (daytime and night-time changes); Table 2 p. 6 (assumed heating penalty); Results p. 8 (payback) | Small sample; heating penalty assumed; funded by the Moses Feldman Family Foundation; coating applied through the White Roof Research Project |
| CRC for Low Carbon Living, 2018 | New South Wales; three shopping centres (Nowra, Shellharbour, Wetherill Park) monitored for about six weeks each; simulations in seven climate zones | Roof and above-roof air temperatures; modelled electricity and gas | Executive Summary pp. 13–15 (surface and air temperatures, simulation averages, cautions); Figure 3.22 caption p. 48 (air between panels); Section 2.4 pp. 25–26 | Mostly summer; the authors caution against extrapolating the simulations and say the above-roof air model needs verifying for winter; funded by CRC for Low Carbon Living Ltd under the Australian Government's Cooperative Research Centres program, with Bluescope Steel and Stockland thanked for steering the project |
| Dominguez et al., 2011 | San Diego; one unoccupied concrete laboratory building | Ceiling temperatures; modelled heat flow | Abstract p. 1 and Section 3.2 p. 12 (2.5 °C at 17:00; flush array warmest at night); Section 2.1 p. 4 (array tilt and height); Section 3.1 p. 9 (19 April analysed) | Single building; data collected from 17 to 20 April 2009; the paper describes ventilation as infiltration only (Section 2.1) and as unventilated (Sections 4 and 6); NASA, NSF and Hellman Foundation support |
| Shukla et al., 2018 | Albuquerque; two test huts, five weeks (8 August to 12 September 2014) | Shingle temperature; heat flux through the ceiling | Section 5 p. 8 and Figure 13 caption p. 25 (49% daily peak heat flux); Section 5 p. 7 and Figure 10 caption p. 20 (13 °C, caption 12.5 °C); Section 5 p. 9 (69% coverage); Abstract and Section 2 (gap); Section 4 p. 6 (dates) | One site and season, two huts; valid only for the conditions tested; US Department of Energy funding; Lumeta Solar and Royal Adhesives and Sealants thanked; no conflict-of-interest statement found |
| Odeh and Pearling, 2025 | Sydney; one roof over a year | Roof temperatures on sample days | Section 3, paragraph on Figure 5 (day and night differences, 10 cm clearance); Section 2.1 (sample days, orientation) | Four sample days a month; no external funding; no conflict of interest declared |
| Berdahl et al., 2008 | Overview of roofing weathering; California samples | Reflectance change after soiling | Section 6 and Table 1 (0.57 to 0.54 after 19 months); Section 2d (soot) | Samples collected in spring; the soot effect shown is expected, not measured |
| Sleiman et al., 2013 | Laboratory method checked against US outdoor exposure sites | How soiling changes reflectance | Section 4.3.3 p. 12 (black carbon); Section 4.6.1 p. 17 (three-year match); Section 4.6.2 p. 18 (no microbial growth) | Calibrated to US conditions; funded by the US Department of Energy |
About this article
Circular Abundance wrote this from the published studies linked above, reading each in full where we could. We have not tested anything ourselves. Every figure in the text comes from one of those studies, and we say where a result is modelled rather than measured. Some sources were available only in part. We retained claims only where we could check the relevant supporting sections, and recorded remaining limitations.
"Established technologies" describes the roofs and panels themselves. It does not mean every cooling outcome is certain: the evidence on how much a particular roof helps is mixed, and it depends on the building and the climate.